
← Back to blog
How to Compare Age-Standardised Scores (SAS) and KS2 Scaled Scores for SATs
October 14, 2025

October 14, 2025
Making sense of pupil data should be simple. With scaled scores, age-standardised scores, and raw marks to navigate, it helps to focus on what matters most: what these numbers show about your pupils’ learning and progress.
At Quest, we believe in keeping assessment data simple, meaningful, and actionable. Here’s how to understand the difference between age-standardised scores and KS2 scaled scores.The essentials

For a simple guide to how raw scores convert into scaled scores, you can refer to the government’s guidance for the 2025 KS2 SATs. The exact thresholds may change slightly each year, so always check the latest update.
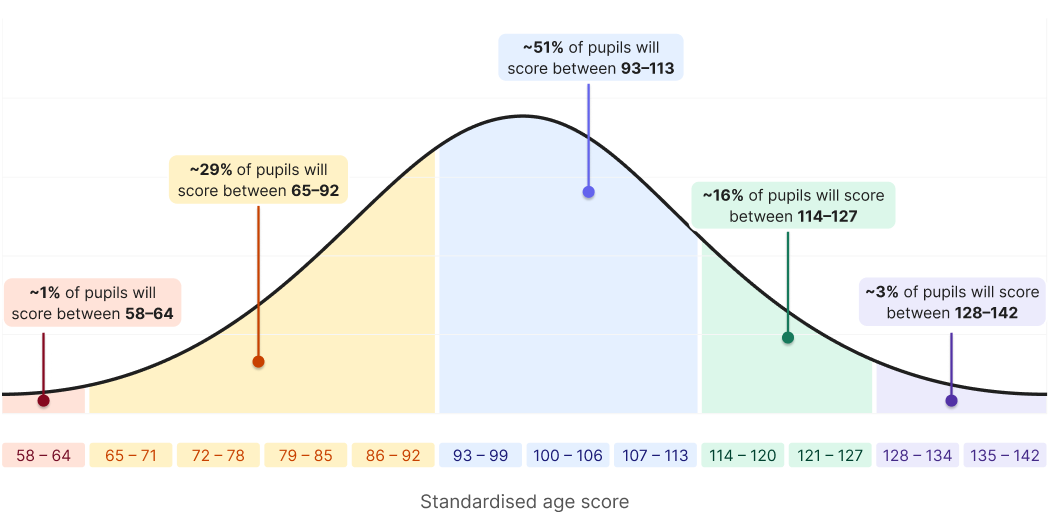
SAS and scaled scores each tell a different part of the story, so their numbers don’t line up exactly.

Instead of matching scores, look at broad categories to see how pupils are performing.
Please use this guide for a more detailed comparison:

Ben is in Year 5 and scored a SAS of 95 in his recent English assessment. This shows us that he is working slightly below the average for his age, but he is still meeting expectations.
His SAS score indicates he is likely to meet expectations and achieve a scale score of ~100 in his Y6 SATs. However, he is close to the threshold and may benefit from targeted intervention.
Aisha is in Year 4 and scored a SAS of 118 in her recent maths assessment. This score shows she is working well above average in comparison to both her peers and national expectations.
Aisha is likely to be working above the expected level in maths when she is assessed in Year 6.
Age-standardised and scaled scores both help explain pupil performance; they just measure it differently.
At Quest, we make data simple, clear, and useful, giving teachers actionable insights to support learning and progress. For more information about the data insights Quest Progress can give your school, book a call here.